Overview
Production possibility curve
A production possibility curve is a curve showing all the possible combinations of two goods that an economy can produce within a specified time period with all its resources fully and efficiently employed.
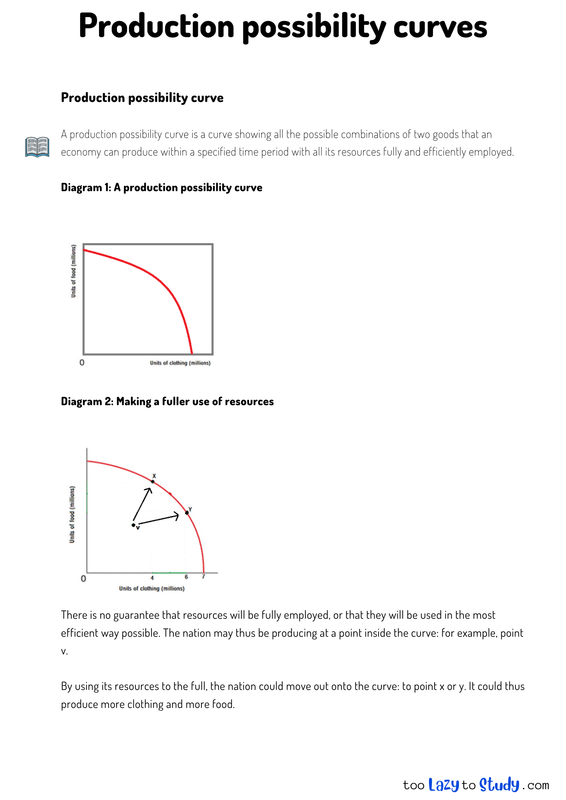
Diagram 2: Making a fuller use of resources
There is no guarantee that resources will be fully employed, or that they will be used in the most efficient way possible. The nation may thus be producing at a point inside the curve: for example, point v.
By using its resources to the full, the nation could move out onto the curve: to point x or y. It could thus produce more clothing and more food.
Assume Jasmin works as a carpenter and divides her time between creating tables and building bookcases. The PPC would show the maximum amount of either tables or bookshelves she could build given her current resources.
.png)
Economics notes on
Production Possibility Curve
Perfect for A level, GCSEs and O levels!