Overview
Consumer surplus
Consumer surplus arises because some consumers are willing to pay more than the given price for all but the last unit they buy.
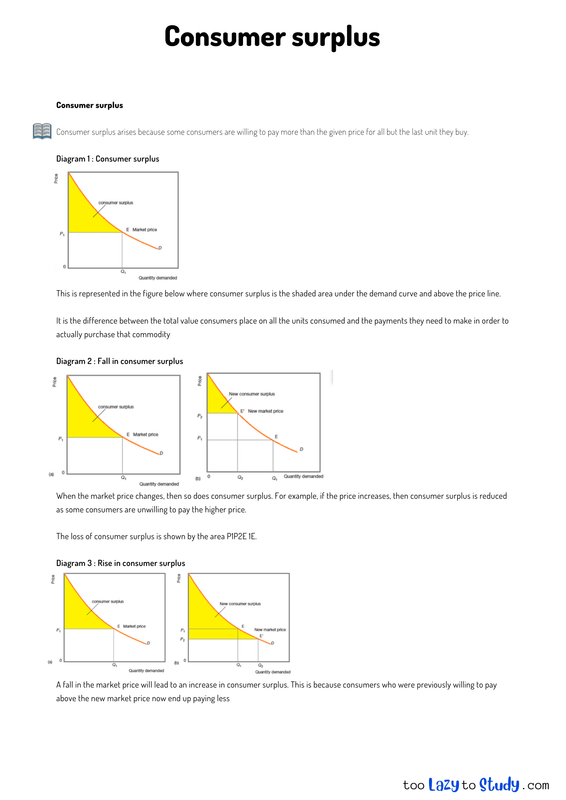
Diagram 1 : Consumer surplus
This is represented in the figure below where consumer surplus is the shaded area under the demand curve and above the price line.
It is the difference between the total value consumers place on all the units consumed and the payments they need to make in order to actually purchase that commodity
Diagram 2 : Fall in consumer surplus
When the market price changes, then so does consumer surplus. For example, if the price increases, then consumer surplus is reduced as some consumers are unwilling to pay the higher price.
The loss of consumer surplus is shown by the area P1P2E 1E.
Diagram 3 : Rise in consumer surplus
A fall in the market price will lead to an increase in consumer surplus. This is because consumers who were previously willing to pay above the new market price now end up paying less
.png)
Economics notes on
Consumer surplus
Perfect for A level, GCSEs and O levels!