top of page
Overview
Demand curves
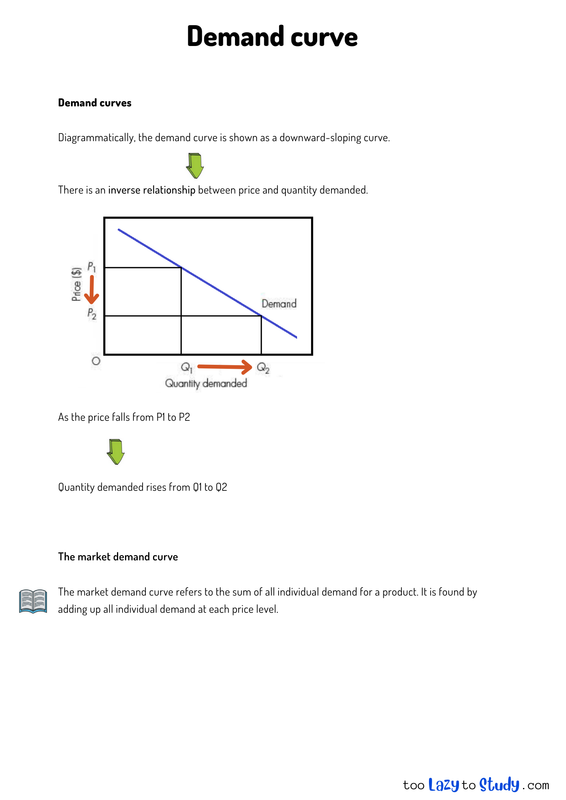
Diagrammatically, the demand curve is shown as a downward-sloping curve.
There is an inverse relationship between price and quantity demanded.
As the price falls from P1 to P2
Quantity demanded rises from Q1 to Q2
The market demand curve
The market demand curve refers to the sum of all individual demand for a product. It is found by adding up all individual demand at each price level.
.png)
Economics notes on
Demand curve
Perfect for A level, GCSEs and O levels!


bottom of page