Overview
Movement in the production possibility curve
A movement in the production possibility curve is caused by the decision to change the composition of goods produced.
For example, this could happen as a result of government directives in a command economy for example or through changes in demand for alternative goods in a market economy.
Slope of the PPC curve
Consider an example where the free market decides to produce more clothing instead of food because it has become more profitable
This sacrifice of food is the opportunity cost of extra clothing.
The fact that to produce more of one good involves producing less of the other is illustrated by the downward sloping nature of the PPC curve.
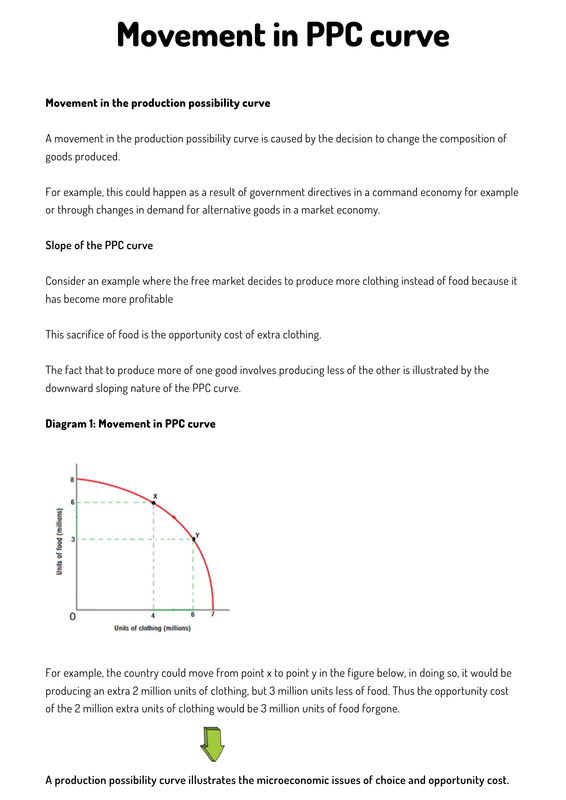
Diagram 1: Movement in PPC curve
For example, the country could move from point x to point y in the figure below, in doing so, it would be producing an extra 2 million units of clothing, but 3 million units less of food. Thus the opportunity cost of the 2 million extra units of clothing would be 3 million units of food forgone.
A production possibility curve illustrates the microeconomic issues of choice and opportunity cost.
.png)
Economics notes on
Movement in PPC curve
Perfect for A level, GCSEs and O levels!