Overview
Producer surplus
Producer surplus and the difference between the price a producer is willing to accept and what is actually paid.
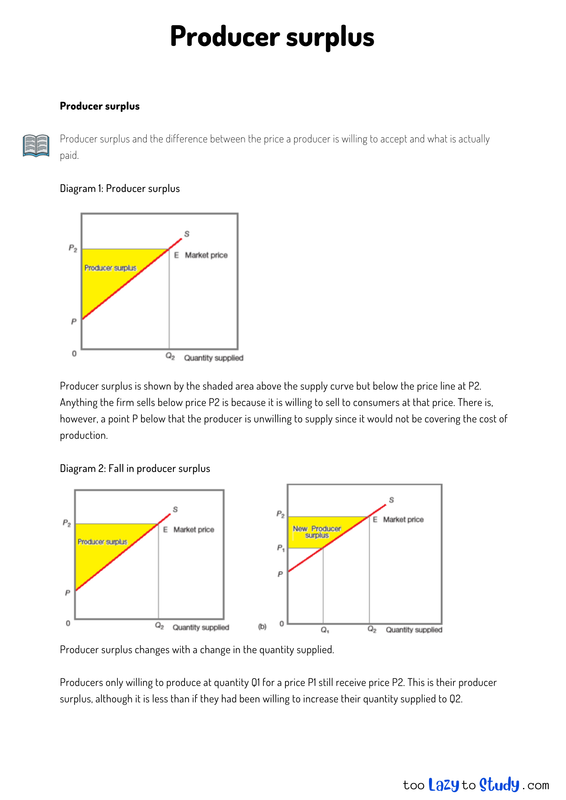
Diagram 1: Producer surplus
Producer surplus is shown by the shaded area above the supply curve but below the price line at P2. Anything the firm sells below price P2 is because it is willing to sell to consumers at that price. There is, however, a point P below that the producer is unwilling to supply since it would not be covering the cost of production.
Diagram 2: Fall in producer surplus
Producer surplus changes with a change in the quantity supplied.
Producers only willing to produce at quantity Q1 for a price P1 still receive price P2. This is their producer surplus, although it is less than if they had been willing to increase their quantity supplied to Q2.
.png)
Economics notes on
Producer surplus
Perfect for A level, GCSEs and O levels!