Overview
There will be a shift in the production possibility curve when economies can gain or lose resources; the quality of resources and the state of technical knowledge can also change.
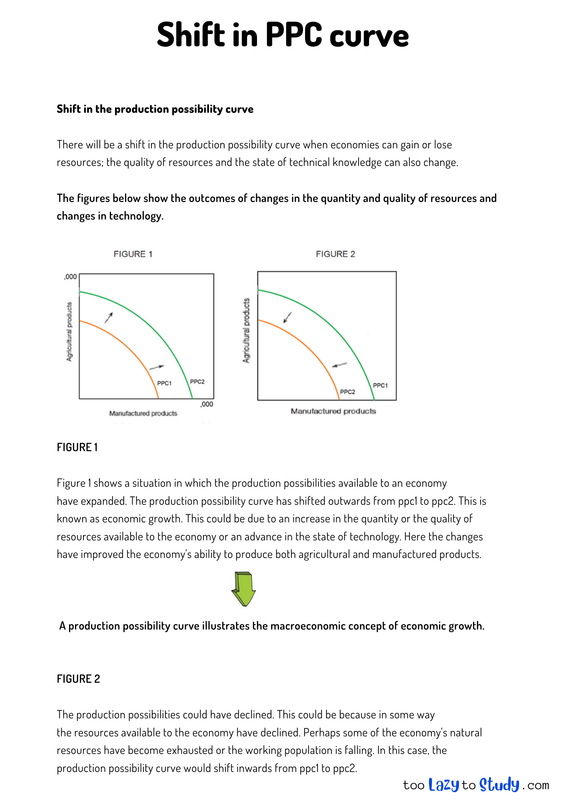
The figures below show the outcomes of changes in the quantity and quality of resources and changes in technology.
FIGURE 1
Figure 1 shows a situation in which the production possibilities available to an economy
have expanded. The production possibility curve has shifted outwards from ppc1 to ppc2. This is known as economic growth. This could be due to an increase in the quantity or the quality of
resources available to the economy or an advance in the state of technology. Here the changes have improved the economy's ability to produce both agricultural and manufactured products.
A production possibility curve illustrates the macroeconomic concept of economic growth.
FIGURE 2
The production possibilities could have declined. This could be because in some way
the resources available to the economy have declined. Perhaps some of the economy's natural
resources have become exhausted or the working population is falling. In this case, the
production possibility curve would shift inwards from ppc1 to ppc2.
.png)
Economics notes on
Shift in the production possibility curve
Perfect for A level, GCSEs and O levels!