top of page
Economics explained
Category:
Behavioral economics
Total Utility Curve
The secret to scoring awesome grades in economics is to have corresponding awesome notes.
A common pitfall for students is to lose themselves in a sea of notes: personal notes, teacher notes, online notes textbooks, etc... This happens when one has too many sources to revise from! Why not solve this problem by having one reliable source of notes? This is where we can help.
What makes TooLazyToStudy notes different?
Our notes:
-
are clear and concise and relevant
-
is set in an engaging template to facilitate memorisation
-
cover all the important topics in the O level, AS level and A level syllabus
-
are editable, feel free to make additions or to rephrase sentences in your own words!
Looking for live explanations of these notes? Enrol now for FREE tuition!
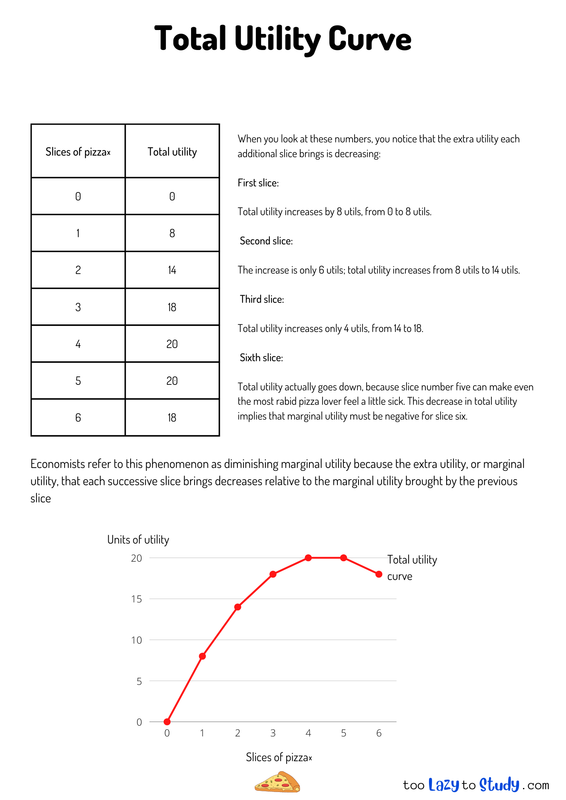
When you look at these numbers, you notice that the extra utility each additional slice brings is decreasing:
First slice:
Total utility increases by 8 utils, from 0 to 8 utils.
Second slice:
The increase is only 6 utils; total utility increases from 8 utils to 14 utils.
Third slice:
Total utility increases only 4 utils, from 14 to 18.
Sixth slice:
Total utility actually goes down, because slice number five can make even the most rabid pizza lover feel a little sick. This decrease in total utility implies that marginal utility must be negative for slice six.
bottom of page